The goal of fazhthemes is to contain my personal {ggplot2} themes.
Installation
You can install the development version of {fazhthemes} from GitHub with:
# install.packages("devtools")
devtools::install_github("fazepher/fazhthemes")
Example
Let’s begin with some data already available in R.
library(fazhthemes)
#> Loading required package: ggplot2
library(tidyverse)
#> ── Attaching packages ─────────────────────────────────────────────────────────────── tidyverse 1.3.0 ──
#> ✓ tibble  3.0.3     ✓ dplyr   1.0.0
#> ✓ tidyr   1.1.0     ✓ stringr 1.4.0
#> ✓ readr   1.3.1     ✓ forcats 0.5.0
#> ✓ purrr   0.3.4
#> Warning: package 'tibble' was built under R version 4.0.2
#> ── Conflicts ────────────────────────────────────────────────────────────────── tidyverse_conflicts() ──
#> x dplyr::filter() masks stats::filter()
#> x dplyr::lag()    masks stats::lag()

UKDriverDeaths_tibble <- UKDriverDeaths %>%
  matrix(nrow=16, ncol=12, byrow = TRUE,
         dimnames = list(1969:1984,month.abb)) %>%
  as.data.frame() %>%
  rownames_to_column("Year") %>%
  pivot_longer(-Year,names_to = "Month", values_to = "Deaths") %>%
  mutate(Month = factor(Month,levels = month.abb,ordered = TRUE))

head(UKDriverDeaths_tibble)
#> # A tibble: 6 x 3
#>   Year  Month Deaths
#>   <chr> <ord>  <dbl>
#> 1 1969  Jan     1687
#> 2 1969  Feb     1508
#> 3 1969  Mar     1507
#> 4 1969  Apr     1385
#> 5 1969  May     1632
#> 6 1969  Jun     1511
tail(UKDriverDeaths_tibble)
#> # A tibble: 6 x 3
#>   Year  Month Deaths
#>   <chr> <ord>  <dbl>
#> 1 1984  Jul     1222
#> 2 1984  Aug     1284
#> 3 1984  Sep     1444
#> 4 1984  Oct     1575
#> 5 1984  Nov     1737
#> 6 1984  Dec     1763
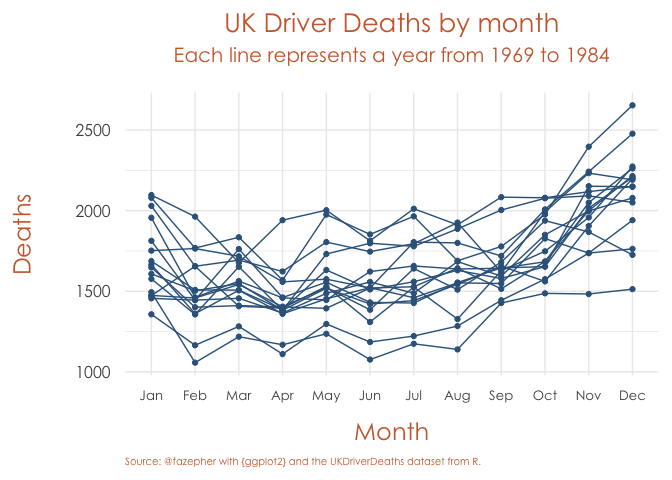
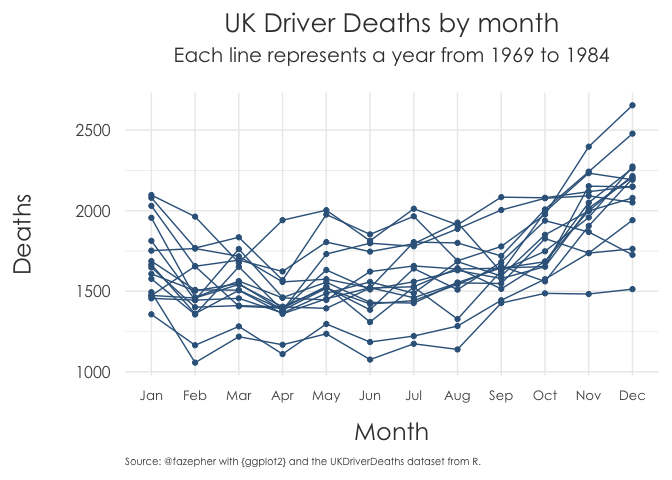
We can explore the monthly driver deaths in the UK for each year in our dataset. From the core themes, I’ve always prefered minimal, so let’s see it. It looks good.
uk_dd_plot <- ggplot(data = UKDriverDeaths_tibble, aes(x=Month,y=Deaths,group=Year)) +
  geom_line(color = "steelblue4") +
  geom_point(color = "steelblue4") +
  labs(title = "UK Driver Deaths by month",
       subtitle = "Each line represents a year from 1969 to 1984",
       caption = "Source: @fazepher with {ggplot2} and the UKDriverDeaths dataset from R.")

uk_dd_plot +
  theme_minimal()
 However, I’m not a fan of several things. First, at work, we mostly use gray texts in our presentations instead of the default black in the plot. Secondly, we never liked the title and subtitles on the left. Thirdly, our corporate prefered font is more similar to the Century Gothic family. So I frequently ended up changing {ggplot2}’s defaults. Furthermore, when working on reports for clients, my coworker Lucía always noted that the axis texts and titles were too small on the actual reports. As she constantly needed to adjust them, and we knew her changes would almost surely result in better plots, it soon became an inside joke: now, let’s lucify the plot. We worked together in order to come up with some other defaults that we felt were appropriate for those needs (and our aesthetic tastes). The result were the lucified core themes. How do they look? Let’s lucify our previous plot!
uk_dd_plot +
  lucify_theme_minimal()
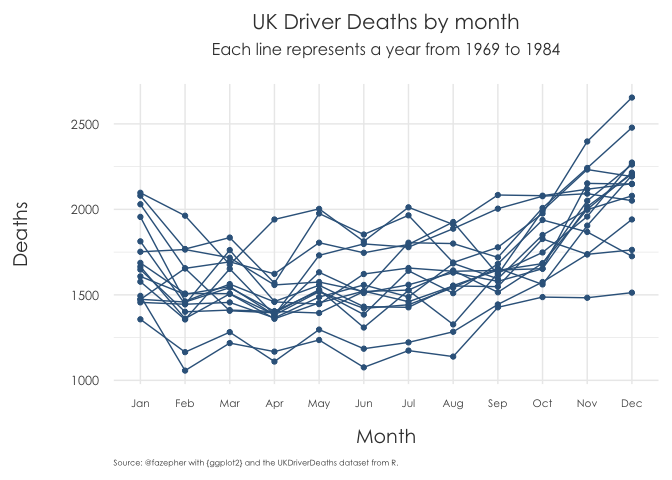
Obviously, like I said, these themes are tailored to our own specific aesthetics. You may not like to change the default family font or want to use your own prefered family (you could also have an error when trying to use Century Gothic, probably because in order to change families in plots, one has to first use the {extrafont} package). You can always change the family with another call, for example adding theme(text = element_text(family = “serif”)), but the lucify theme functions allow you to specify it directly with the text_family argument.
uk_dd_plot +
  lucify_theme_minimal(text_family = "serif")

Likewise, if you feel we have chosen too big text sizes you can scale back with the text_size argument.
uk_dd_plot +
  lucify_theme_minimal(text_size = 12)
Lastly, there is a text_color argument. This feature is still in development, in terms of its interaction with the different themes. Currently, for the lucified minimal theme it doesn´t change the axis text color, for example.
uk_dd_plot +
  lucify_theme_minimal(text_color = "sienna3")